library(dplyr)
library(ggplot2)
library(ggokabeito)   # color-blind-safe (Okabe-Ito) scale
data(penguins)
penguins <- penguins |> filter(!is.na(bill_len), !is.na(bill_dep), !is.na(body_mass))Analysis
Body mass by species
ggplot(penguins, aes(species, body_mass, fill = species)) +
  geom_boxplot(show.legend = FALSE) +
  scale_fill_okabe_ito() +
  labs(x = NULL, y = "Body mass (g)")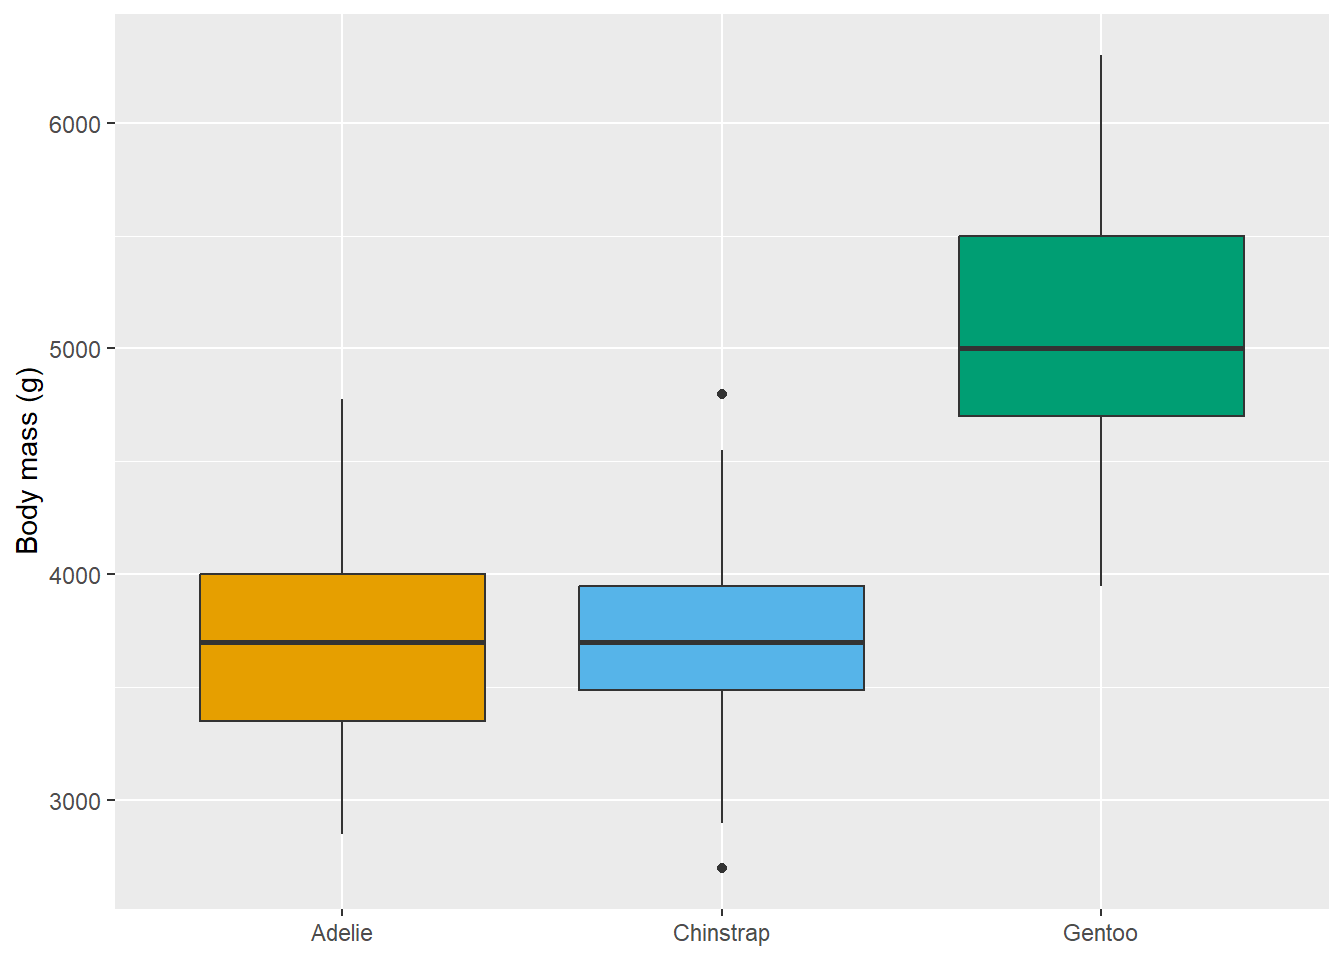
Figure 1 shows that Gentoo penguins are clearly the heaviest of the three species.
Mean measurements
penguins |>
  summarise(
    bill_len = mean(bill_len),
    bill_dep = mean(bill_dep),
    body_mass = mean(body_mass),
    .by = species
  ) |>
knitr::kable(digits = 1)| species | bill_len | bill_dep | body_mass |
|---|---|---|---|
| Adelie | 38.8 | 18.3 | 3700.7 |
| Gentoo | 47.5 | 15.0 | 5076.0 |
| Chinstrap | 48.8 | 18.4 | 3733.1 |