library(dplyr)
library(ggplot2)
library(ggokabeito)   # color-blind-safe (Okabe-Ito) scale
data(penguins)
penguins <- penguins |> filter(!is.na(bill_len), !is.na(bill_dep), !is.na(body_mass))My report
The Day-1 document, now a page on the site.
This page stands in for the report you built on Day 1. Copy your own my-report.qmd over this file and re-render: the document you wrote as a standalone PDF becomes one page of a website, with no change to its content.
Only the YAML header needs to change. A page inside a project inherits format: from _quarto.yml, so a format: typst left over from the Day-1 document would keep building a PDF instead of a page.
ggplot(penguins, aes(bill_len, bill_dep, color = species)) +
  geom_point(alpha = 0.8) +
  scale_color_okabe_ito() +
  labs(x = "Bill length (mm)", y = "Bill depth (mm)", color = NULL)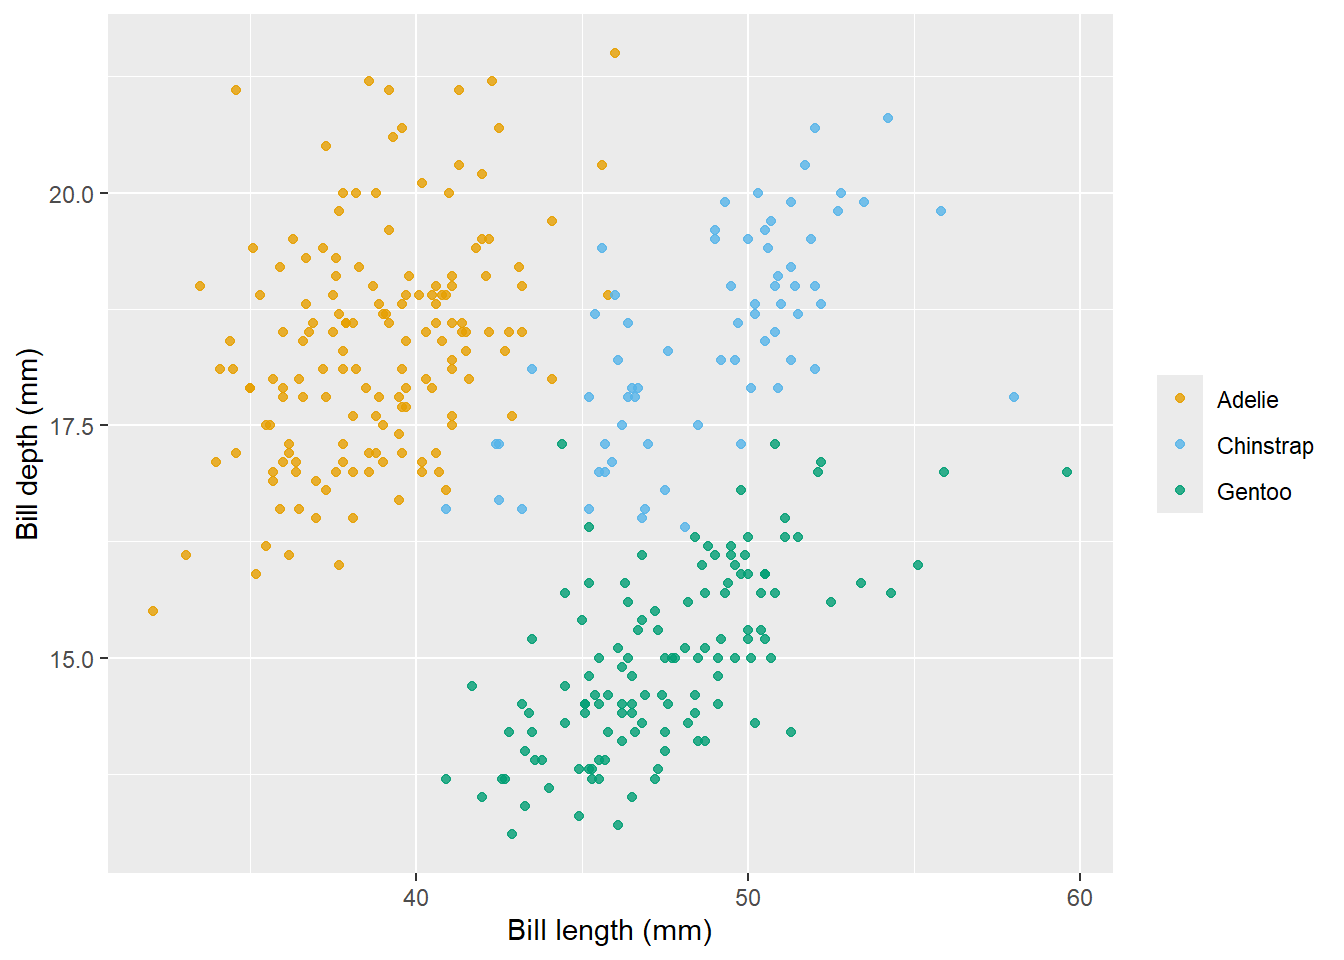
Figure 1 still resolves, because the reference and its figure share one page.